

Millions of older Americans are targeted by financial scams each year. One analysis published by the U.S. Department of the Treasury found $27 billion in suspected elder financial exploitation in just a 12-month period. As digital banking, payments and communication become more common, scammers have more ways to reach victims and impersonate trusted institutions. Phishing scams, including business imposter and government imposter fraud, are among the most common methods used to target older Americans.
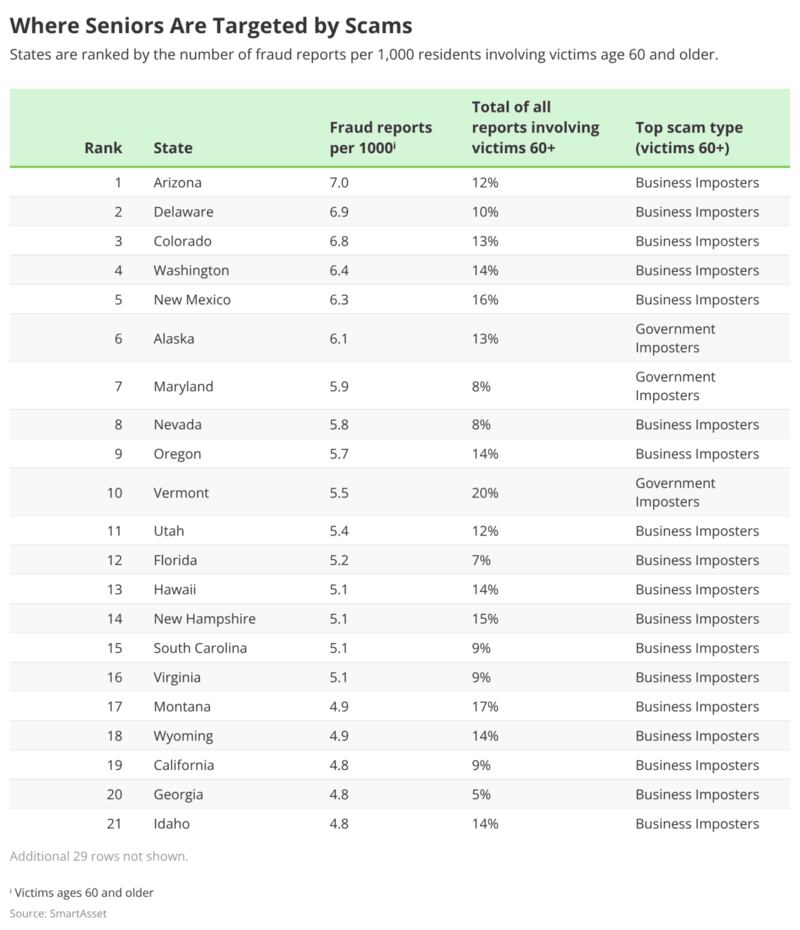
SmartAsset analyzed fraud reports filed with the Federal Trade Commission by state and age group to determine which areas show the highest rate of reported scams involving residents aged 60 and older. The analysis also identified the most common scam type targeting older Americans in each state.
Key Findings
- This popular retirement state recorded the highest rate of reported scams involving older Americans. Arizona led the analysis with seven reports involving residents aged 60 and older per 1,000 people in that age group. Delaware and Colorado followed in the rankings.
- North Dakota recorded the lowest rate of reported scams involving older Americans. With just three reports involving residents age 60 and older for every 1,000 people in that age group, North Dakota had the fewest reported incidents in the analysis.
- Business imposter scams were the most commonly reported scam type involving older Americans in most states. Among the 10 most common scam types, older Americans most often reported business imposter scams in every state except Alaska, Iowa, Maryland, South Dakota, Vermont, and West Virginia. In those states, residents most often reported government imposter scams.
- Older Americans report job fraud and online shopping fraud less often than younger groups. Nationwide, reports involving older Americans were less likely than those involving younger age groups to cite either scam type.
SmartAsset
States Where Older Americans are Targeted for Financial Fraud
- Arizona
Fraud reports involving victims ages 60 and older per 1,000: 7
Share of all fraud reports involving victims ages 60 and older: 12%
Top scam type affecting victims ages 60 and older: Business imposters - Delaware
Fraud reports involving victims ages 60 and older per 1,000: 6.9
Share of all fraud reports involving victims ages 60 and older: 10%
Top scam type affecting victims ages 60 and older: Business imposters - Colorado
Fraud reports involving victims ages 60 and older per 1,000: 6.8
Share of all fraud reports involving victims ages 60 and older: 13%
Top scam type affecting victims ages 60 and older: Business imposters - Washington
Fraud reports involving victims ages 60 and older per 1,000: 6.4
Share of all fraud reports involving victims ages 60 and older: 14%
Top scam type affecting victims ages 60 and older: Business imposters - New Mexico
Fraud reports involving victims ages 60 and older per 1,000: 6.3
Share of all fraud reports involving victims ages 60 and older: 16%
Top scam type affecting victims ages 60 and older: Business imposters - Alaska
Fraud reports involving victims ages 60 and older per 1,000: 6.1
Share of all fraud reports involving victims ages 60 and older: 13%
Top scam type affecting victims ages 60 and older: Government imposters - Maryland
Fraud reports involving victims ages 60 and older per 1,000: 5.9
Share of all fraud reports involving victims ages 60 and older: 8%
Top scam type affecting victims ages 60 and older: Government imposters - Nevada
Fraud reports involving victims ages 60 and older per 1,000: 5.8
Share of all fraud reports involving victims ages 60 and older: 8%
Top scam type affecting victims ages 60 and older: Business imposters - Oregon
Fraud reports involving victims ages 60 and older per 1,000: 5.7
Share of all fraud reports involving victims ages 60 and older: 14%
Top scam type affecting victims ages 60 and older: Business imposters - Vermont
Fraud reports involving victims ages 60 and older per 1,000: 5.5
Share of all fraud reports involving victims ages 60 and older: 20%
Top scam type affecting victims ages 60 and older: Government imposters - Utah
Fraud reports involving victims ages 60 and older per 1,000: 5.4
Share of all fraud reports involving victims ages 60 and older: 12%
Top scam type affecting victims ages 60 and older: Business imposters - Florida
Fraud reports involving victims ages 60 and older per 1,000: 5.2
Share of all fraud reports involving victims ages 60 and older: 7%
Top scam type affecting victims ages 60 and older: Business imposters - Hawai'i
Fraud reports involving victims ages 60 and older per 1,000: 5.1
Share of all fraud reports involving victims ages 60 and older: 14%
Top scam type affecting victims ages 60 and older: Business imposters - New Hampshire
Fraud reports involving victims ages 60 and older per 1,000: 5.1
Share of all fraud reports involving victims ages 60 and older: 15%
Top scam type affecting victims ages 60 and older: Business imposters - South Carolina
Fraud reports involving victims ages 60 and older per 1,000: 5.1
Share of all fraud reports involving victims ages 60 and older: 9%
Top scam type affecting victims ages 60 and older: Business imposters - Virginia
Fraud reports involving victims ages 60 and older per 1,000: 5.1
Share of all fraud reports involving victims ages 60 and older: 9%
Top scam type affecting victims ages 60 and older: Business imposters - Montana
Fraud reports involving victims ages 60 and older per 1,000: 4.9
Share of all fraud reports involving victims ages 60 and older: 17%
Top scam type affecting victims ages 60 and older: Business imposters - Wyoming
Fraud reports involving victims ages 60 and older per 1,000: 4.9
Share of all fraud reports involving victims ages 60 and older: 14%
Top scam type affecting victims ages 60 and older: Business imposters - California
Fraud reports involving victims ages 60 and older per 1,000: 4.8
Share of all fraud reports involving victims ages 60 and older: 9%
Top scam type affecting victims ages 60 and older: Business imposters - Georgia
Fraud reports involving victims ages 60 and older per 1,000: 4.8
Share of all fraud reports involving victims ages 60 and older: 5%
Top scam type affecting victims ages 60 and older: Business imposters - Idaho
Fraud reports involving victims ages 60 and older per 1,000: 4.8
Share of all fraud reports involving victims ages 60 and older: 14%
Top scam type affecting victims ages 60 and older: Business imposters - Alabama
Fraud reports involving victims ages 60 and older per 1,000: 4.6
Share of all fraud reports involving victims ages 60 and older: 8%
Top scam type affecting victims ages 60 and older: Business imposters - Nebraska
Fraud reports involving victims ages 60 and older per 1,000: 4.6
Share of all fraud reports involving victims ages 60 and older: 13%
Top scam type affecting victims ages 60 and older: Business imposters - Connecticut
Fraud reports involving victims ages 60 and older per 1,000: 4.5
Share of all fraud reports involving victims ages 60 and older: 9%
Top scam type affecting victims ages 60 and older: Business imposters - Maine
Fraud reports involving victims ages 60 and older per 1,000: 4.5
Share of all fraud reports involving victims ages 60 and older: 16%
Top scam type affecting victims ages 60 and older: Business imposters - North Carolina
Fraud reports involving victims ages 60 and older per 1,000: 4.5
Share of all fraud reports involving victims ages 60 and older: 8%
Top scam type affecting victims ages 60 and older: Business imposters - Rhode Island
Fraud reports involving victims ages 60 and older per 1,000: 4.5
Share of all fraud reports involving victims ages 60 and older: 11%
Top scam type affecting victims ages 60 and older: Business imposters - Indiana
Fraud reports involving victims ages 60 and older per 1,000: 4.4
Share of all fraud reports involving victims ages 60 and older: 10%
Top scam type affecting victims ages 60 and older: Business imposters - Minnesota
Fraud reports involving victims ages 60 and older per 1,000: 4.4
Share of all fraud reports involving victims ages 60 and older: 13%
Top scam type affecting victims ages 60 and older: Business imposters - Kansas
Fraud reports involving victims ages 60 and older per 1,000: 4.3
Share of all fraud reports involving victims ages 60 and older: 13%
Top scam type affecting victims ages 60 and older: Business imposters - Massachusetts
Fraud reports involving victims ages 60 and older per 1,000: 4.3
Share of all fraud reports involving victims ages 60 and older: 10%
Top scam type affecting victims ages 60 and older: Business imposters - New Jersey
Fraud reports involving victims ages 60 and older per 1,000: 4.3
Share of all fraud reports involving victims ages 60 and older: 7%
Top scam type affecting victims ages 60 and older: Business imposters - Texas
Fraud reports involving victims ages 60 and older per 1,000: 4.3
Share of all fraud reports involving victims ages 60 and older: 6%
Top scam type affecting victims ages 60 and older: Business imposters - Missouri
Fraud reports involving victims ages 60 and older per 1,000: 4.2
Share of all fraud reports involving victims ages 60 and older: 9%
Top scam type affecting victims ages 60 and older: Business imposters - Tennessee
Fraud reports involving victims ages 60 and older per 1,000: 4.2
Share of all fraud reports involving victims ages 60 and older: 9%
Top scam type affecting victims ages 60 and older: Business imposters - Wisconsin
Fraud reports involving victims ages 60 and older per 1,000: 4.2
Share of all fraud reports involving victims ages 60 and older: 13%
Top scam type affecting victims ages 60 and older: Business imposters - Illinois
Fraud reports involving victims ages 60 and older per 1,000: 4.1
Share of all fraud reports involving victims ages 60 and older: 7%
Top scam type affecting victims ages 60 and older: Business imposters - Michigan
Fraud reports involving victims ages 60 and older per 1,000: 4.1
Share of all fraud reports involving victims ages 60 and older: 9%
Top scam type affecting victims ages 60 and older: Business imposters - Ohio
Fraud reports involving victims ages 60 and older per 1,000: 4.1
Share of all fraud reports involving victims ages 60 and older: 10%
Top scam type affecting victims ages 60 and older: Business imposters - Pennsylvania
Fraud reports involving victims ages 60 and older per 1,000: 4.1
Share of all fraud reports involving victims ages 60 and older: 8%
Top scam type affecting victims ages 60 and older: Business imposters - Arkansas
Fraud reports involving victims ages 60 and older per 1,000: 4
Share of all fraud reports involving victims ages 60 and older: 10%
Top scam type affecting victims ages 60 and older: Business imposters - New York
Fraud reports involving victims ages 60 and older per 1,000: 4
Share of all fraud reports involving victims ages 60 and older: 7%
Top scam type affecting victims ages 60 and older: Business imposters - Oklahoma
Fraud reports involving victims ages 60 and older per 1,000: 4
Share of all fraud reports involving victims ages 60 and older: 11%
Top scam type affecting victims ages 60 and older: Business imposters - Kentucky
Fraud reports involving victims ages 60 and older per 1,000: 3.9
Share of all fraud reports involving victims ages 60 and older: 12%
Top scam type affecting victims ages 60 and older: Business imposters - South Dakota
Fraud reports involving victims ages 60 and older per 1,000: 3.8
Share of all fraud reports involving victims ages 60 and older: 14%
Top scam type affecting victims ages 60 and older: Government imposters - Mississippi
Fraud reports involving victims ages 60 and older per 1,000: 3.7
Share of all fraud reports involving victims ages 60 and older: 7%
Top scam type affecting victims ages 60 and older: Business imposters - Louisiana
Fraud reports involving victims ages 60 and older per 1,000: 3.6
Share of all fraud reports involving victims ages 60 and older: 6%
Top scam type affecting victims ages 60 and older: Business imposters - Iowa
Fraud reports involving victims ages 60 and older per 1,000: 3.5
Share of all fraud reports involving victims ages 60 and older: 13%
Top scam type affecting victims ages 60 and older: Government imposters - West Virginia
Fraud reports involving victims ages 60 and older per 1,000: 3.1
Share of all fraud reports involving victims ages 60 and older: 13%
Top scam type affecting victims ages 60 and older: Government imposters - North Dakota
Fraud reports involving victims ages 60 and older per 1,000: 3
Share of all fraud reports involving victims ages 60 and older: 10%
Top scam type affecting victims ages 60 and older: Business imposters
Methodology
This analysis examined fraud reports submitted to the Federal Trade Commission in 2024, the most recent year for which data was available. To evaluate where older Americans may be most frequently targeted, the number of fraud reports involving victims aged 60 and older per 1,000 residents in that age group in each of the 50 states was calculated. Population estimates for residents ages 60 and older were drawn from the U.S. Census Bureau’s 2024 state population estimates. In addition to this primary rate, the share of all fraud reports in each state involving victims aged 60 and older was calculated to provide additional context. States were ranked based on the rate of reports per 1,000 residents age 60 and older, and the most commonly reported scam type affecting that age group in each state was identified using FTC complaint categorization data. Because FTC data reflects reported incidents rather than all instances of fraud, actual fraud levels may be higher than reported totals, and differences in reporting behavior may influence comparisons. Source data providers are not affiliated with, and do not endorse or sponsor, this study or its findings.
This story was produced by SmartAsset and reviewed and distributed by Stacker.